
Being able to pitch newsmaker survey results locally in addition to nationally opens up many additional journalists to reach out to.
You might want to pitch reporters in the leading metropolitan areas: New York, Los Angeles, Chicago, Dallas, etc. You might want to pitch journalists in the largest states: California, Texas, Florida, New York, etc. You might want something very custom, as SpotOn did:
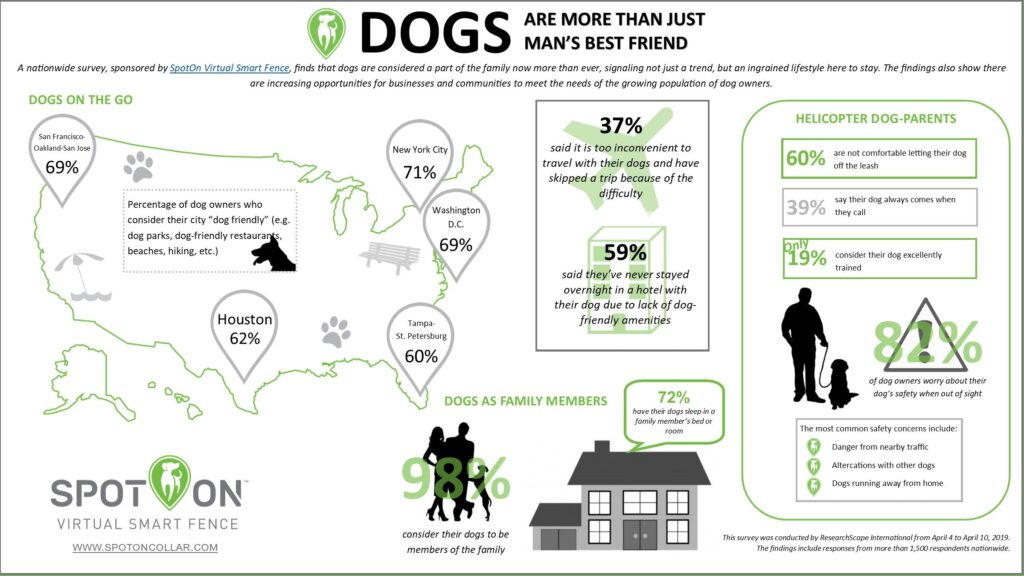
That’s a nationwide survey of 1,000 consumers, with an additional 100 consumers in each of five metropolitan areas.
How many results do you need? That depends whether your focus is on comparing and contrasting (“How New Yorkers Differ From Angelenos When It Comes To…”) or profiling their region (“Where Floridians/Arizonans/Texans Are Vacationing This Summer”). Also how many questions you have:
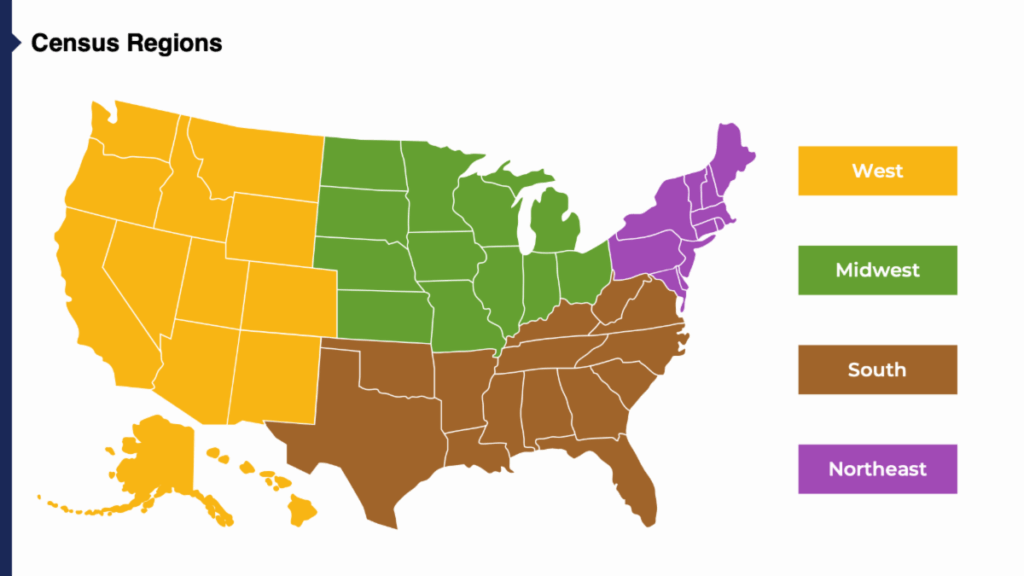
- Weekend Omnibus – 5 questions – Always representative of the US as a whole, more or less proportional to actual state populations, but can provide details for the four Census regions.
- Flash Poll – 10 questions – You can allocate the sample of 1,000 however you want. We typically recommend at least 400 nationwide and then 100 per state or metro area you want to focus on for 6 states or cities. We can also do ~111 per each of the nine Census divisions (see map below).
- Profiled B2C – 20 questions – Again, you can allocate the sample of 1,000 however you want.
- Custom Survey – 10 questions – Sample size of 50 per state.
Here was the distribution of responses from a recent omnibus, as an example:
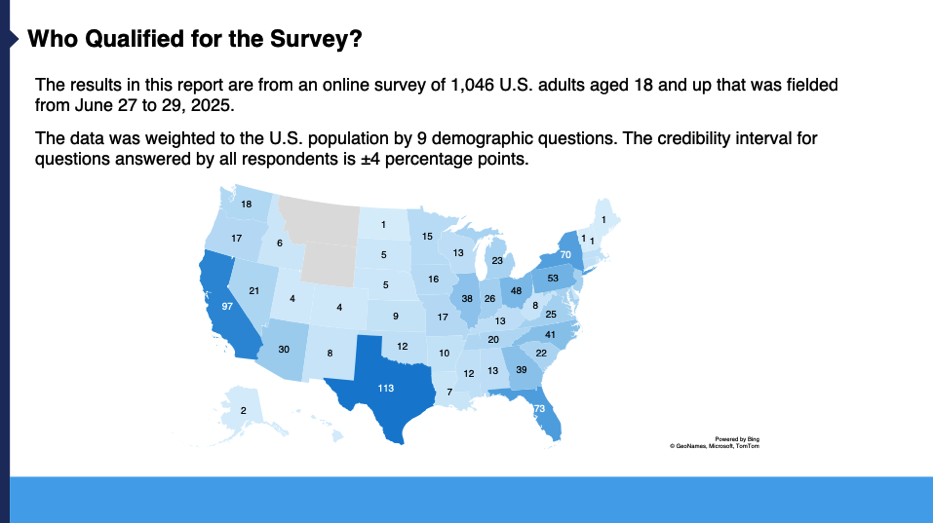
We had respondents in every state but Wyoming (50th in population) and Montana (44th). We had 174 responses in the Northeast, 197 in the West, 206 in the Midwest, and 414 in the South.
From a research perspective, because we can use the entire sample for comparisons, as long as we have 30 responses in a subsample, we can identify if the differences are statistically significant at a very reliable level (because we’re comparing 30 to the other 970, in that example). The bigger the sample size the smaller the differences which are statistically significant. But, even though we can run the stat test on as few as 30 for a region, typically you’re going to want more to report out these results separately.
We’ve had clients feel like they needed a sample size of 250 to pitch regional press, and others say that 100 was enough: 250 is more common when pitching a few areas on their own results (NYC, Chicago, LA) and 100 is more common when comparing and contrasting quite a few areas and then pitching the differences.
The credibility interval (like margin of error, but for online surveys) is about plus or minus 10 percentage points for a sample size of 100, 7 pts. for 200, 6 pts. for 250, and 4 pts. for 1,000.
Like SpotOn, you can turn single surveys into multi-market media campaigns, opening doors to journalists you never could have reached with national-only results.
Author Notes:
Jeffrey Henning
