
When you analyze and report survey results, focus on the story you want to tell – don’t assume the questionnaire’s structure is the best for analysis.
A properly designed questionnaire provides a narrative thread that conversationally moves the respondent from one question to—if possible—another closely related question, abruptly changing topics as few times as necessary. The order of specific questions might be further dictated by the need to screen out respondents with particular demographics, to collect verbatim responses up front before biasing perceptions with subsequent closed-ended questions, and to wrap up by collecting important but personally intrusive demographic information.
While this questionnaire structure may come to seem inevitable, especially after multiple rounds of revision, it was designed to improve the experience of respondents. As a result, it may have little or no relationship to the proper order of material for another audience: those being presented the research.
Tip 1 – Your job is to rearrange the questions into an order that best tells the story of the data.
For great reports, take a tip from great reporters – follow the inverted pyramid style of reporting: answer up front the essential business questions that prompted the research in the first place. Start with your conclusions and support them, rather than accumulating evidence. Only then give the detail for those of your readers with the time and interest.
Think of the interest levels of 3 types of readers as you write your report:
- Those who want the big picture and key findings of the study;
- Those who want the conclusions with supporting details;
- Those who want the details of the entire body of research or may need to reference it to answer subsequent questions.
Each audience needs to be able to take something from your research report that is relevant to their work. Whether senior management or junior analyst, include something for everyone.
Write the report as if the reader won’t read all of it! Journalists in the 19th century often wrote flamboyant, meandering news accounts that took their time to get to the actual story that they were reporting. The growing professionalization of journalism 110 years ago stimulated the development of the inverted pyramid style of reporting, with a summary news lead followed up by further detail.
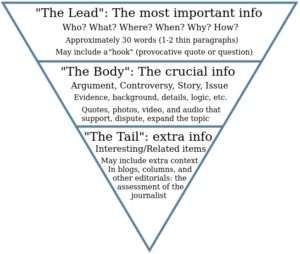
The advantage? Editors could cut the article to fit a specific physical location in the newspaper while still reporting the most important details (the phrase cut and paste literally comes from this practice). The added benefit for readers was that they could skim headlines and first paragraphs to get a general sense of the news and could stop reading at any point. Create your report in the same way!
Tip 2 – Don’t assume the existing question choices are the best way to present the results either.
By re-categorizing the choices respondents were shown, you can present the results in a more presentation-friendly manner. Most survey systems simply spit out results in questionnaire order, and show the actual choices given, often in the order they were given. Add-on analytical packages, on the other hand, such as ResearchStory, provide users the flexibility to restructure the data to better discover insights, and typically show scales in question order but nominal lists (such as cities) from the most frequent to the least.
For example, in one survey, respondents were recruited from four Metropolitan Statistical Areas. Yet whether the respondent was in Savannah or Kansas City, Charleston or Oklahoma City was irrelevant; what was important was that a radio campaign was being tested in two of the cities (the Test Markets) and not the other two (the Control Markets). Accordingly, a “Market” variable was created that re-categorized the cities; the market was most important, with the city only being indirectly of interest. Additionally, a variety of national campaigns, including “Social media”, “Web search”, and “Web banner ads” were tracked, but – since the business decision makers were keenly interested in the success of web marketing overall – these choices were grouped together for presenting certain analyses, resulting in a much better presentation of the findings.
The questionnaire itself represents only some of the building blocks for your analysis; don’t treat it as the framework or blueprint. Depart from it in terms of structure and data points.
Updated from an article originally published April 26, 2015. Illustration of inverted pyramid created by Christopher Schwartz; used by permission.
Author Notes:
Jeffrey Henning
