Respondents are the life blood of survey research, and we regularly conduct research to serve them better. One item that surprised some attendees of my MRII ESOMAR webinar on questionnaire design was the volume of rich responses that I get to my survey closing question, “(Optional.) What, if anything, could we do to improve the quality of this survey?”
Some key themes:
- Not understanding the question. For instance, the respondent who wrote, “type out some of the acronyms, i may know products by the label versus the acronym.” That’s great advice, and something we generally try to follow, but must have missed on a question or two in that survey.
- Wanting to opt out of answering. “Next time, give a ‘I don’t know’ or ‘Not applicable’ choice of response to the questions, please!” “An ‘I don’t know’ option would be nice.” “Allow a not familiar option for the last questions.” We typically provide these options, but sometimes clients prefer to edit them out, wanting respondents to take a stand.
- Requesting “Other (please specify)”. “There were a couple questions that didn’t quite give me an answer that I would choose. There might have been space to include an option of ‘other’.” “Other than maybe adding choices, I thought the quality of the questionnaire was very good.” “Overall I wish there was a greater option for typing my own answer.” We try to always add an “Other” to a list of choices and, if the client would prefer that we not, instead rephrase the question to say, “From the following…”
- The appearance of the survey. We bumped up the font size of our surveys from 16 points to 18 points after getting comments like these from respondents: “The text needs to be larger as I have problem vision.” “Bigger font but it was good.” “Larger font.” Respondents also complain if the survey is visually boring: “Pictures, please!” “More colors.”
- Length. We wrote about this last month (“The Ideal Survey Length”). Respondents typically prefer shorter surveys: “Try taking the survey yourself and time yourself and then change the time to something real not 7 minutes.” “It was WAY too long.” “Make it shorter.”
- Personal questions. “I don’t think the personal questions should be there, they are irrelevant.” “I thought a lot of the questions were too personal.” “I feel you don’t need to know any personal information of a survey taker just for them to take surveys.” We actually do need demographic information, to make sure the data is representative and to understand differences by subgroups.
The feedback question is also great for pre-tests or soft-launches. Internal testing is important, but sometimes misses things. From a pre-test: “Pay attention to when I said I was unemployed at the very beginning.” We discovered that one page’s visibility logic used the wrong question, which we were able to flag and fix before the full launch. In a soft launch of a survey of SMB owners, about use of legal services, one of the first respondents commented, “I’m a lawyer, so this survey really didn’t apply to me.” So we added industry to the screener and screened out lawyers (2% were screened out). I hadn’t expected any lawyers to be taking that survey!
Besides providing feedback, conscientious respondents use our final open-end to point out their own mistakes: “My internet/cable provider is Xfinity. I hit wrong key when asked.” (They could have clicked the Back button to change their answer, but didn’t.) “Fix the one question where I had to pick American Samoa because it wouldn’t drop down other options?” This was a weird, one-off browser bug, perhaps based on bandwidth issues. Or, my favorite, a recent great response from a participant: “i lied”. (We paid their incentive, but deleted their response.)
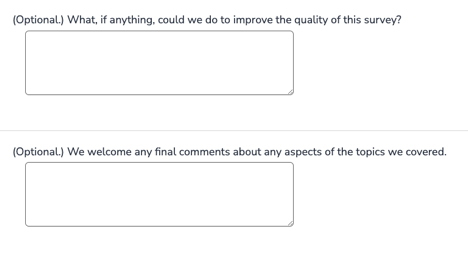
This is how we used to end surveys:

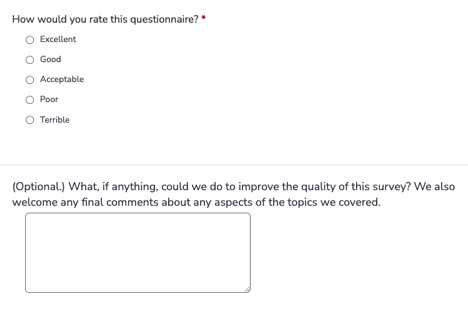
We had hoped that the second textbox would provide some interesting color commentary specific to the theme of the survey, but it rarely did. As a result, in 2022, we switched to a closed-ended question with a double-barreled open-end (normally something to avoid):

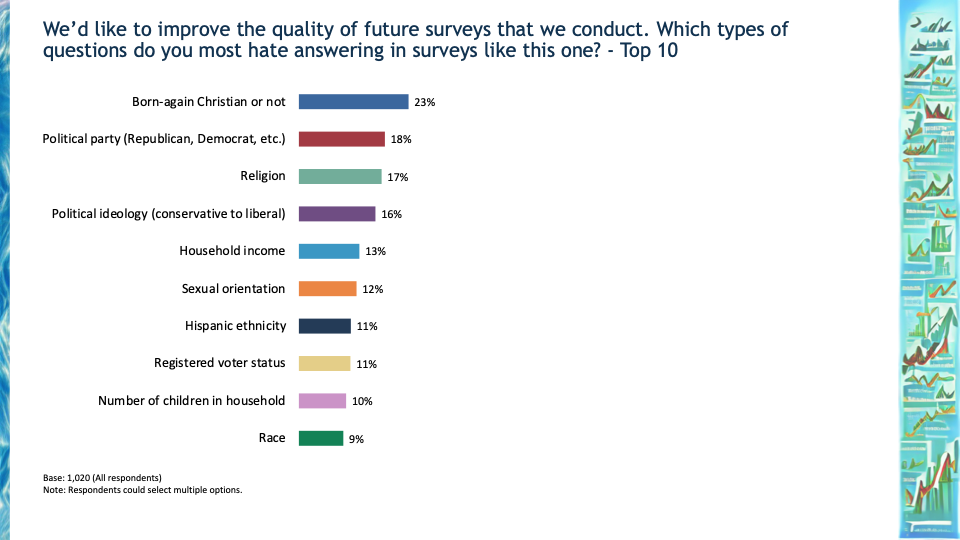
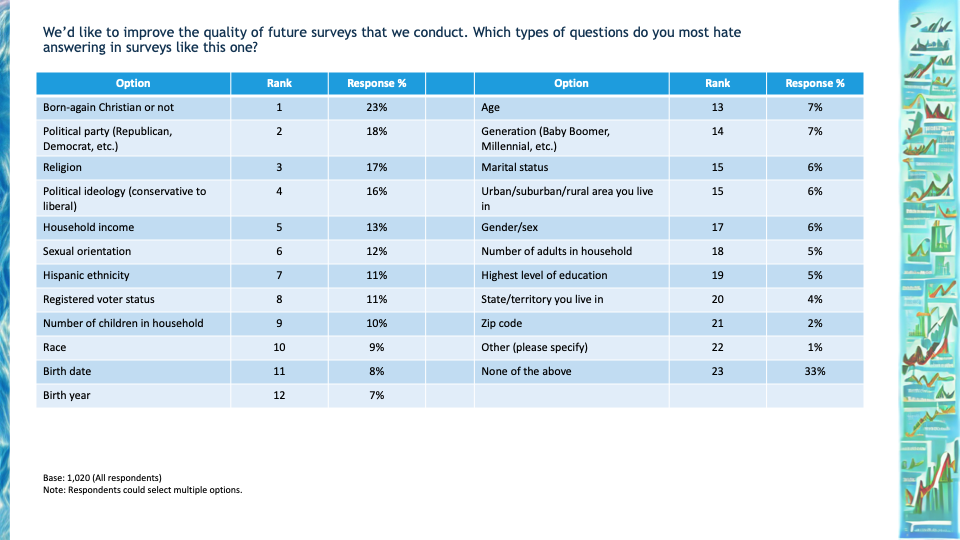
We also do ad hoc research into the respondent experience. Because of the number of complaints about “personal questions”, we appended a question about what they hate to answer, after an expanded series of U.S. demographic questions.
Respondents most dislike questions about religion, politics, and income. We now use APIs to pull common demographics from our list partners’ databases instead, and we now ask religion and political party only if necessary for social research. (We were using it for survey weighting but found it made only a small difference to most market research studies, yet aggravated many participants.)

We also wondered which method of asking age was least liked: it was birthdate (8%) but there was little difference from asking age, generation, or birth year (7% each).

Engaged respondents are less likely to speed through surveys or grow frustrated with questions, and more likely to provide higher quality data. Our attention to respondent experience has paid off. In 2022, 47% of our respondents rated our surveys as “excellent”, up 3 percentage points from 2021, a statistically significant difference given the hundreds of thousands of surveys collected.
