The American Association of Public Opinion Researchers encourages journalists to ask how newsmaker surveys were weighted. Yet, of surveys announced in 2021 news releases, only 9% were weighted.
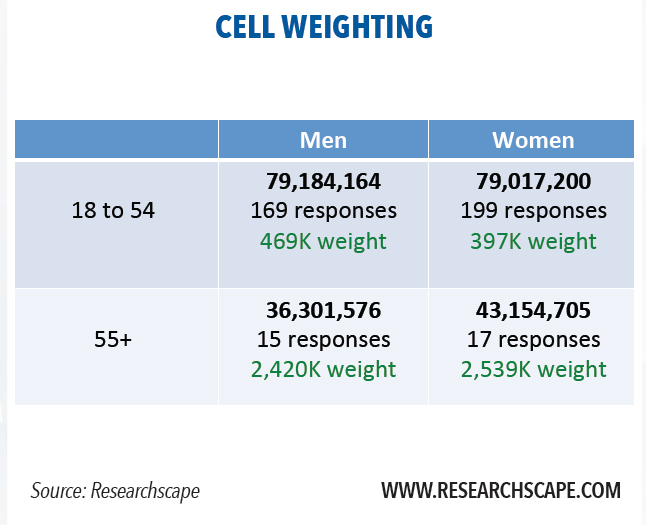
Post-stratification weighting is typically done once a survey is complete to make the results more closely conform to the national totals for key demographic categories. Cell weighting is the simplest form of such weighting – for instance, group responses by demographic cells such as age and gender (men under 55, men 55+; women under 55, women 55+) then calculate the weight for each cell so that it reflects the target population’s proportions.

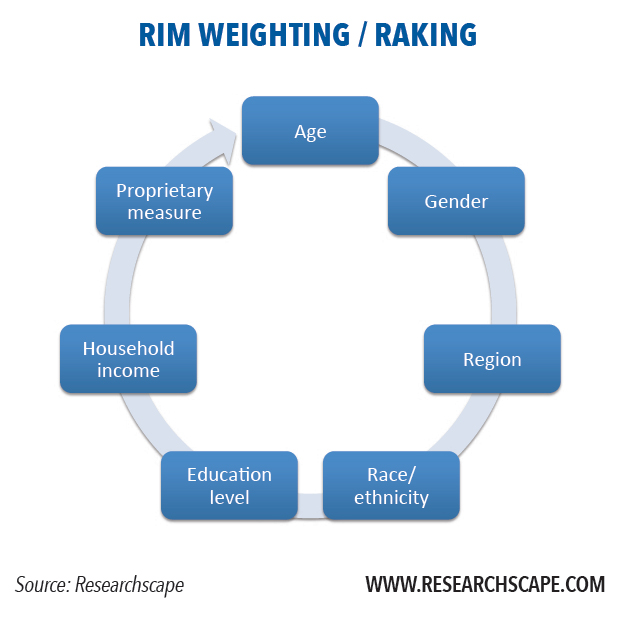
Weighting is too often presented as a simple problem of arithmetic: upweight certain respondents to compensate for undersampling them. In fact, weighting is an editorial process, and what factors people weight responses on differs dramatically. Newsmaker surveys that are weighted are almost always weighted by at least age, gender and geographic region. More extensive weighting attempts to bring even more variables into alignment with the target population: race/ethnicity, education and household income. Certain organizations champion unique weighting variables as part of proprietary methods to improve representativeness: for instance, news interest or panel tenure. Most organizations that weight presume that weighting by additional factors produces greater representativeness.
While cell weighting was once commonplace, it is gradually giving way to raking. Cell weighting needs to calculate the weight per cell. Its key weakness is that it requires knowing the target population breakdowns of each cell – the percent of people who are female, Hispanic, 55+, and live in the South, for instance. Raking, in contrast, is an iterative process of recalculating the weights so that the weighted totals line up for one attribute in the target population. Raking repeats the process for a different attribute each cycle, taking the weights of its past output as the new input; the process repeats dozens of times until results converge for all weighted attributes when compared to the target population.
The advantage of raking is that there is no need to know the internal detailed cross-tabulation for each demographic cell or subgroup.

With raking, weights are often different respondent to respondent, reflecting their unique demographic characteristics. As a result, the weights on different respondents can vary dramatically. Widely divergent weights reduce the effective sample size. If you interview 400 people, but 80% of them are men, your reweighted total sample is effectively 256 respondents. Weighting produces much wider margins of sampling error (for probability samples).
Once upon a time, weighting was presumed to make up for any errors in convenience sampling. But researchers now realize that poststratification weighting is not a magical fix. How the responses were sampled is important, with quota sampling important at a minimum. As Reg Baker has written, “Waiting until the weighting stage to adjust is too late…. We need to do more at the selection stage.”
The assumption implicit in weighting is that the people we did survey in a particular demographic group are representative of the people that we did not survey. Yet this assumption is unlikely to hold true in many non-probability samples and is another reason more needs to be done at the selection stage. For instance, respondents 80 years old and up who take a survey most likely differ in key ways relating to technology usage, health and mental alertness from those who didn’t take the survey; unacculturated Hispanics may differ significantly from the acculturated Hispanics who dominate responses to English-language surveys in the U.S. Historically, most commercial researchers have used post-stratification weights on non-probability samples. They do so in the hope that it does no harm, in the belief that it improves quality, and due to the fact that it redistributes demographic reporting to match the target population. For instance, a survey with 1% of its respondents 80 years old or older, when weighted, reports as if it surveyed the 5% of U.S. adults who are that age.
Pew Research Center has demonstrated that weighting improves the representativeness of opt-in consumer surveys when weighting by many more demographic questions than standard practice. Of the surveys referenced in our newsmaker research, only 9% of 2021 surveys were weighted. Of the 212 that were weighted across the database, including older surveys, 42% were weighted by age, 35% by gender, 31% by region, and 22% by race. Only 19% were weighted by educational attainment, which needs to be weighted as adults without college educations are underrepresented in online surveys. For multinational research, possibilities include weighting by national population, weighting by incidence of the targeted subgroup (e.g., product purchasers), and weighting by market revenue, depending on the goals of the research. For instance, weighting a study by population can exaggerate the role of India and China (37% of the world’s population) for many markets.
Another time to use weighting is when disproportionately sampling (oversampling) key groups. For instance, a common study design is to do 100 surveys in each of five countries, so that the countries can be compared and contrasted; the topline results are then weighted to match the overall population across all five countries, so that – for instance – Canadian responses don’t overshadow American responses 9 to 1 (as they would if left unweighted).
Weighting surveys not only improves the reliability of the results: for newsmaker surveys, weighting differentiates your survey from most published studies.
Originally published 2016-09-16. Revised and updated with new links on 2022-01-28.
