With the NFL draft today, many rumors and predictions have been rumbling for weeks, waiting to see what players will be picked by which teams. While many watching will be satisfied with the results, not everyone can be pleased; a portion of the fans will simply not be happy with the selections made by their team. Nor with the commissioner.
Satisfaction with the NFL last year varied greatly depending on who you asked, ranging from being entertained with the games but disappointed in the referees.
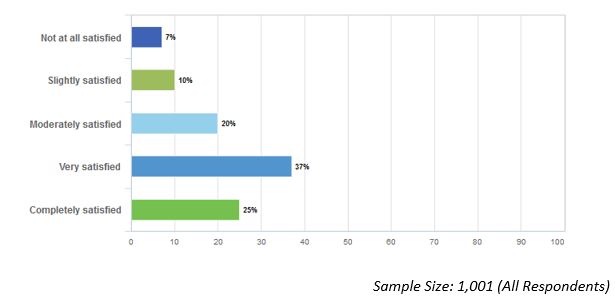
Overall Satisfaction
Back in January, Researchcape partnered with Toluna to survey over 1,000 Americans about satisfaction with the NFL. Just under two thirds of respondents (62%) are very or completely satisfied with the National Football League, while 17% are not at all satisfied or only slightly satisfied.
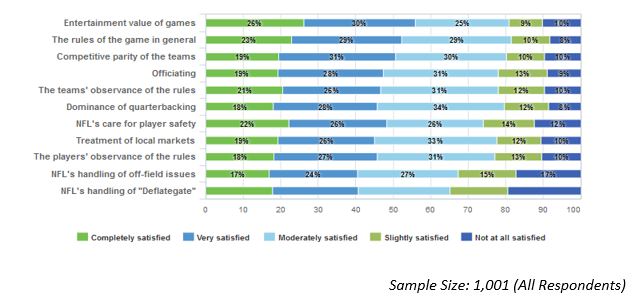
Satisfaction with Key Aspects
Respondents were most satisfied with the entertainment value of games (56% were very or completely satisfied), the rules of the game in general (52% very or completely satisfied), and the NFL’s care for player safety (48%). As one respondent said, “I find it very entertaining, and competitive. The games are usually very close and exciting. The athletic ability of the football players is impressive.”
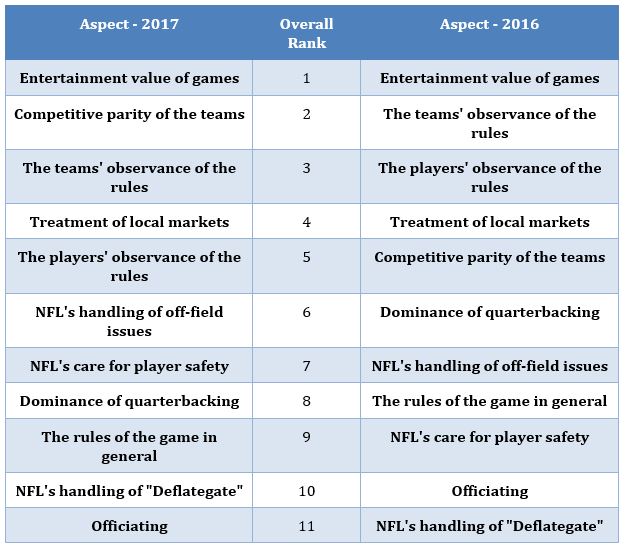
Satisfaction Changes Since 2016
The key drivers causing satisfaction or dissatisfaction with the NFL are similar to last year. Entertainment value of the games remained at #1, with the teams’ observance of rules jumping up from #3 to #2. The players’ observance of the rules went from #5 to #3), while handling of local markets remained #4 – especially relevant with recent team moves from St. Louis and San Diego to Los Angeles. (The survey predated the announced move of the Raiders to Las Vegas.)
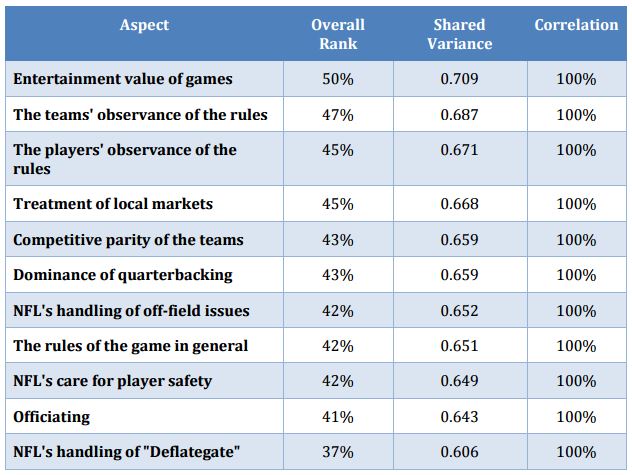
Key Driver Analysis
What drives overall ratings? Entertainment value of games has the highest correlation to the overall rating (50% of shared variance), followed by the teams’ observance of the rules (47%) and the players’ observance of the rules (45%).
The closer the correlation is to 1.000, the greater the two measures correlate. However, the range is exponential, so a .900 correlation (and a -.900 correlation) means that 81% of the variance between the two measures is shared or overlaps, while a .800 correlation means that 64% of the variance does, and a .700 correlation means that 49% of the variance is shared.
Respondents’ overall ratings had much less correlation to their ratings of the rules of the game in general, the handling of “Deflategate,” and officiating.
 This is an excerpt from the free Researchscape white paper, “Sports Superstitions & The Big Game”. Download your own copy now:
Author Notes:
Jeffrey Henning
