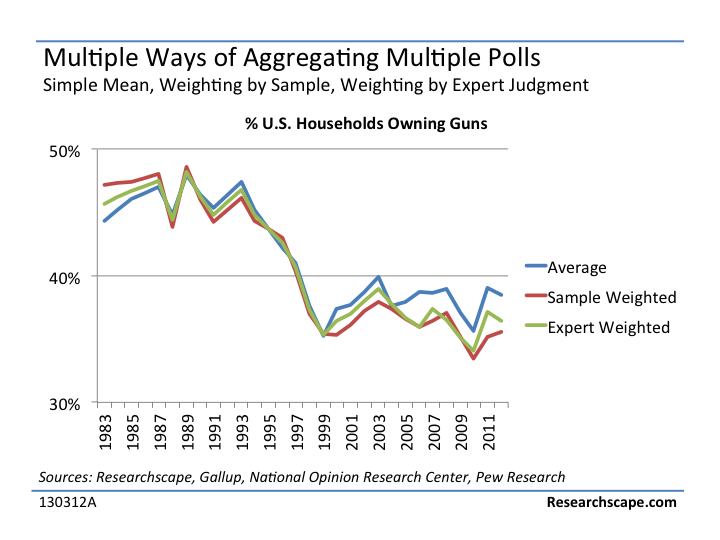
When you are aggregating poll results, as we did yesterday for our article on gun ownership, should you take the average of the results, weight them by sample size, or weight them in some other way?
This is an open question for me, as I have approached the problem differently depending on the data sets.
Averaging them – This has the advantage of being neutral. The analyst isn’t judging the relative merits of the different sources but is simply including them all. This is what we do when calculating the Consumer Confidence Average Index.
Weighting them by custom weights – Here the analyst puts her thumb on the scale and says, “I’m going to discount the results of this poll, because…” For the gun ownership research, I put my thumb on the scale, discounting the Gallup poll in comparison to NORC and Pew, both of which to my mind seem methodologically more rigorous. If I were doing it again, I would take my thumb off the scale – it resulted in at most a 2 point swing for any given year, yet introduces a level of bias that I now must defend.
Weighting them by sample size – Though this is frequently suggested to me, I almost never do it, for three reasons.
First, I no longer believe the sample size that is reported. Of course I believe the research firm interviewed that many respondents, but with the increasing reliance on weighting, the effective sample size may be much lower. For instance, the YouGov estimate of gun ownership uses 4,000 Internet surveys drawn from 4 weekly surveys, but the weights for the last weekly wave of the survey “range from 0.2 to 6.3, with a mean of one and a standard deviation of 0.89”. In other words, all pigs are equal but some animals – er, respondents – are worth 3% of other respondents. This is not at all to pick on YouGov, who does online surveys better than just about anybody: YouGov fields such large surveys precisely to address this issue, but it means that we shouldn’t weight their survey twice as much as GSS’s 2,000 surveys, which are derived from a rigorous schedule of face-to-face and telephone surveys with multiple interview requests.
Second, as we like to remind ourselves in disclaimers to surveys: “sampling error is just one form of error”. Different firms make quite different errors from one another, in ways we can’t readily quantify – a firm with a lower sample size may in fact have higher quality. For instance, in gun ownership research, the mode effects are confounding. Will the Internet survey be more truthful, or the face to face, or the random phone survey? For instance, some gun rights advocates argue that in phone surveys many gun owners are distrustful of data collection and will deny owning guns, deflating all reports of gun ownership.
Third, the last reason not to do sample weighting is that firms often do a poor job of reporting the sample size for each year of multi-year data, making this time consuming to track down, if possible. I challenge you to find the sample size of Gallup’s 1959 survey!
When aggregating, the mean old mean seems more and more attractive.
Author Notes:
Jeffrey Henning
