
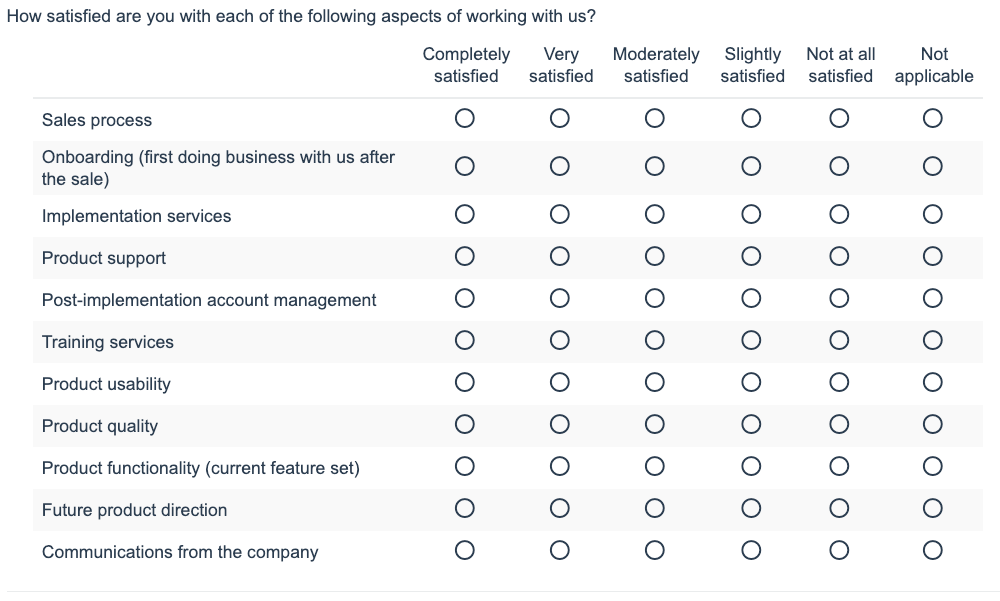
Grid or matrix questions are a concise technique for visually representing a series of items to be rated on a common scale. Unfortunately, grid questions raise a number of issues:
- Most importantly, participants dislike them, and they lead to poorer quality data. Only 72% said “I liked this survey” for a questionnaire using a traditional grid, vs. 80% for the same questions administered in an item-by-item format (though showing multiple items per page). The difference is starker because 6% dropped out of the traditional grid, vs. 1% for the item-by-item format. The traditional grid also had the worst correlation between opposing statements, -0.342 vs. 0.407 (source: “Grappling with Grids” by Jené Grandmont, Lynn Goetzinger, Bob Graff, and Kara Dorbecker).
- Participants can be prone to “straightline” their answers to matrix questions, selecting the same choice for each row, in a virtual straight line down the grid.
- In an SSI case study, participants completed the grid almost 20 times faster than the battery of regular questions: they took half a second per item in a grid but 8 to 10 seconds per item-by-item question. Faster speed of completion may lead to errors.
- Interestingly, Vidal Diaz de Rada and Juan Antonio Domínguez found that participants completing grids in mail surveys showed greater acquiescence, more extreme response categories, and more rows left unanswered (“The quality of responses to grid questions as used in web questionnaires”, 2013).
- According to research conducted by Knowledge Networks, participants may become confused about which item they are rating: “It seems that on a grid it is much easier to ‘miss’ the meaning of the items, resulting in more inconsistencies than when evaluating one item per screen” (“Presentation of a Single Item Versus a Grid”, Mario Callegaro, et al).
- According to “‘Up Means Good’: The Effect of Screen Position on Evaluative Ratings in Web Surveys”, by Roger Tourangeau, Mick P. Couper, and Frederick G. Conrad in 2013, items rated on a common scale received more favorable ratings if they occurred at the top of the list and more negative ratings if they occurred at the bottom. In an additional paper, “The Design of Grids in Web Surveys”, the authors find that dividing grids up into separate questions reduces missing data.
The simple way to address these issues is to ask the questions separately instead (called “item-by-item format”). Splitting the matrix into its component questions has greater predictive validity according to SSI’s report “Grid Test Summary” (March 2009), perhaps precisely because doing so does take participants more time to answer each question. In “An experiment comparing grids and item-by-item formats in web surveys completed through PCs and smartphones,” Melanie Revilla, Daniele Toninelli, and Carlos Ochoa replicated this work, finding longer completion times for the item-by-item format and concluding that using this format improves the comparability of responses collected from smartphones vs. computers.
Item-by-item presentation is often done automatically when rendering surveys for the web, depending on the survey tool. For instance, the first two rows of the above grid question are displayed as the following screens on a mobile phone:


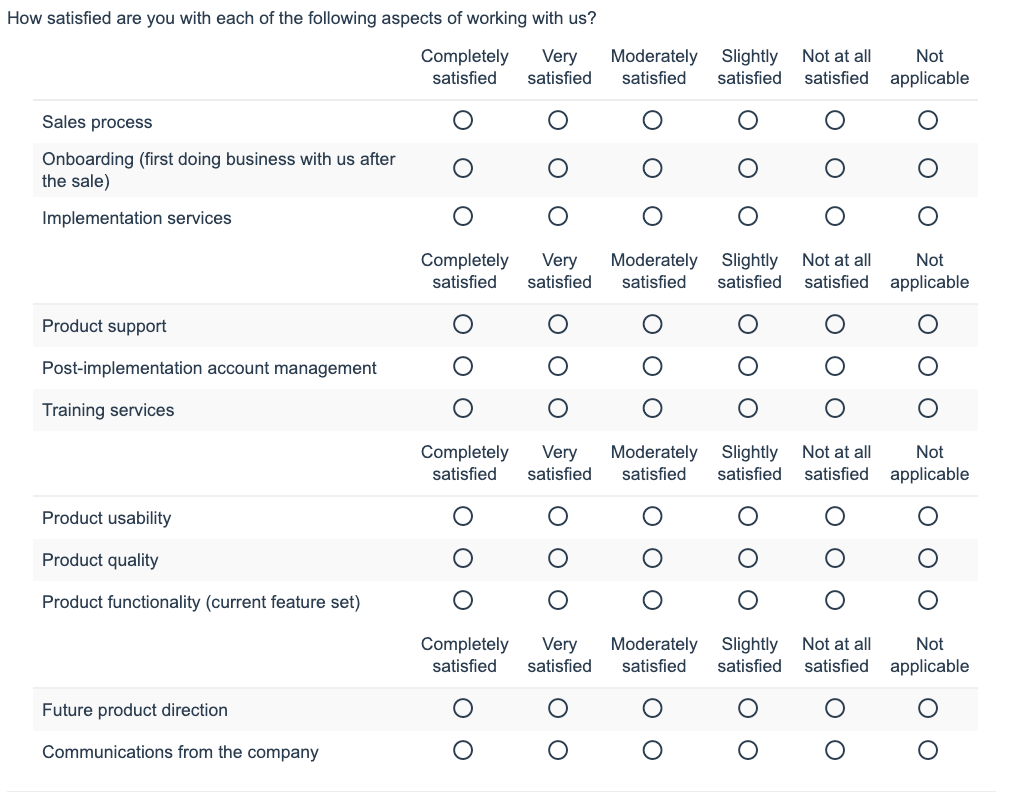
For times where the grid cannot be avoided, make sure to repeat column headings regularly, to minimize confusion about which labels goes with which row when selecting a radio button:
Alternatively, for large-sample size studies, consider iceberg matrices, where a subset of the rows are shown at random to each respondent, improving the respondent experience while trading off a lower sample size per row.
In the Journal of Market Research, David Gal and Derek D. Rucker, authors of the article “Answering the Unasked Question: Response Substitution in Consumer Surveys”, suggest a newly observed participant behavior that can reduce the quality of survey data. “We propose that participants’ answers to questions might sometimes reflect attitudes that participants want to convey, but that the researcher has not asked about, a phenomenon we term response substitution.” While the authors didn’t discuss the impact on grid questions, longer grid questions may be less prone to response substitution than shorter questions, as participants assume that one of the rows will cover the topic important to them; research has already shown that longer grids (10 items vs. 5 items) reduce the halo effect.
Finally, grids consisting of agreement scales are best rewritten to use construct-specific scales.
(Originally published 2019-Jun-24. Examples and graphics updated.)
Author Notes:
Jeffrey Henning
