The most common question we get asked is “How many people should we survey?” The answer is at the intersection of cost and error range. Let’s tackle error range first.
When we do probability surveys of house lists, here is the margin of error depending on the number of responses we receive (“sample size”):
| Sample Size per Item | Margin of Error |
|---|---|
| 29 | ±18% |
| 32 | ±17% |
| 36 | ±16% |
| 40 | ±15% |
| 46 | ±14% |
| 53 | ±13% |
| 62 | ±12% |
| 73 | ±11% |
| 87 | ±10% |
| 106 | ±9% |
| 133 | ±8% |
| 170 | ±7% |
| 226 | ±6% |
| 314 | ±5% |
| 465 | ±4% |
| 757 | ±3% |
| 1433 | ±2% |
| 3539 | ±1% |
| 13243 | <±1% |
*This assumes the full house list has at least 20,000 members.
So if 60% of 100 respondents say that they prefer option A to option B, then 19 times out of 20 the actual value – if you were able to survey every one on the list – would be between 50% and 70% (i.e., 60% ±10%).
These errors also apply to subsamples, so even if you have 120 responses (+/-9%) overall, subsamples of 3 groups of 40 each have an error margin of ±15%. The need to make accurate comparisons between subsamples (by demographic or by industry) can dramatically increase the desired sample size. Skip patterns and branching in effect produce subsamples, of respondents who answered one question vs. another, producing a sample size per item that is lower than the overall sample size.
While probability sampling is great for e-commerce companies, which have a record of every customer and can therefore conduct rigorous research, most organizations acquire some mix of customers offline or even through third parties (e.g., resellers, franchisees, etc.). In such cases, the total population can’t be probability sampled, and the margin of error can’t be calculated.
The margin of sampling error is widely reported in public opinion surveys because it is the only error that can be reliably calculated. But many other types of error occur: generally categorized as “non-sampling error“, these include mistakes in how the question was asked (e.g., leading questions, incomplete choice lists) or interpreted (e.g., being misread or misheard), among many others.
The average absolute error can be estimated by comparing the results to a known quantity – predicting a field already in the house list, for instance, or predicting consumer demographics that have been researched by a national census. But many businesses conduct so few surveys that they can’t develop empirical observations of absolute error.
For panel surveys, which are not probability samples, the theoretical margin of error can’t be calculated. It is safe to assume that the absolute error in practice will be larger than the margin of error. So the general rule of thumb at smaller sample sizes is that more is better, with diminishing returns past 465 per subgroup.
If you have a large house list, collect around 465 completed responses per key subgroup, if doing so will leave aside sufficient sample for other upcoming projects. Your concern is mainly around survey fatigue. The cost will be the same, unless you are using a survey platform that charges by response, otherwise house-list surveys should be a fixed cost.
If you have a small house list, you need to attempt a census, due to the paradox of surveys of small population sizes.
The sample size you should survey is, most often, a trade-off.
Finally, if you don’t have a house list, collect as many surveys as you can afford to, weighing the costs against the importance of the business decision you are seeking to make – or the amount of publicity you are seeking to gain. The wider the audience, the cheaper the survey: consumer surveys cost less than horizontal-market surveys, which cost less than vertical-market surveys.
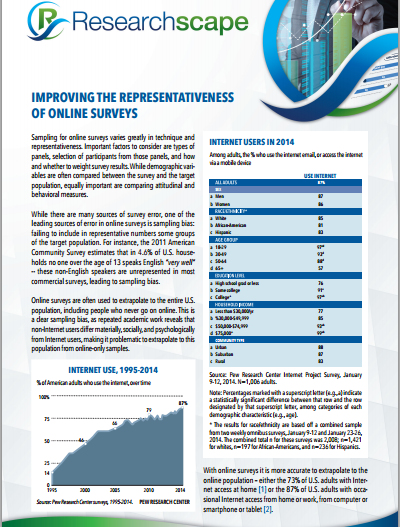
 For more on this topic, check out the free Researchscape white paper, “Improving the Representativeness of Online Surveys”. Download your own copy now.