Last week in Bristol, the Association of Survey Computing had its first international conference in four years – its sixth international conference overall – and it was a phenomenal celebration of the opportunities for survey research.
Tom Ewing kicked off the conference with his presentation “Twilight of the Respondents”, asking attendees to listen to the stories we tell ourselves, because these stories affect the balancing act of research and “shape the directions of innovation”. Research, to Tom’s mind, can be represented as a triangle bounded by the end points of technology, clients and respondents: “It’s part of a fragile and changeable balance.”
Tom hears three main types of stories we tell ourselves about this balance: ghost stories, about the ghost town of survey research where the absence of respondents haunts us; science fiction stories, where we make first contact with social media “aliens” and realize they outnumber regular respondents; and spy stories, where we realize that our respondents can’t be sure of their own motives or allegiances. “Our stories about respondents pull in multiple directions,” Tom said – from a world of no questions (the ghost story) to a world of no answers (science fiction story) to a world where answers can’t be trusted (the spy story). How do we synthesize these stories?
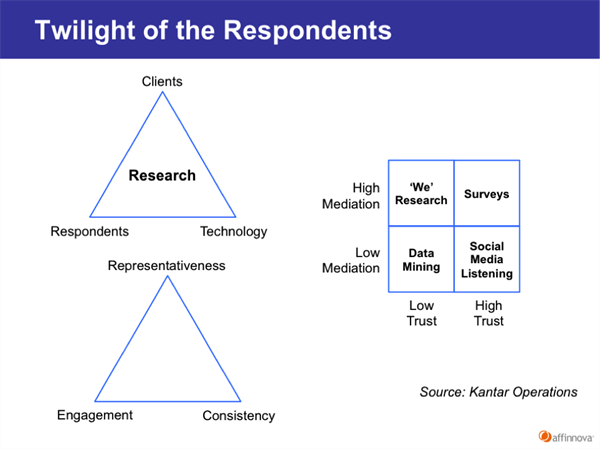
As one possible synthesis, Tom proposes a quadrant with axes of mediation and trust. High trust, high mediation represents traditional surveys; high trust, low mediation represents social media listening; low trust, low mediation uses passive data collection; and low trust, high mediation can be represented by “‘we’ research”, where respondents report on one another rather than on themselves.
Simon Atkinson of Ipsos MORI and Sean Conry of Techneos Systems gave an example of this triangulation in action for their study, “The old… and the new: The great British Royal Weekend”. To understand attitudes towards the royal wedding, they conducted a traditional public opinion telephone survey, social media listening and a mobile self-ethnography. While many British citizens expressed indifference about the upcoming wedding in the survey, social listening caught a tremendous amount of activity the day of the wedding and the mobile ethnography caught people who had low expectations for the day yet found that it increased their communal belonging and made them feel proud to be British. Each method caught complementary information.
Looking specifically at social media, Joe Murphy of RTI International tried to replicate the famous study that showed Google searches on “flu” were predictive of actual Center for Disease Control data on flu outbreaks two weeks before the CDC published their results. Since RTI tracks illegal drug usage through a 70,000-respondent survey each year, as an experiment they turned to Google and Twitter to see if it could complement their survey. They chose salvia, a hallucinogenic herb legal in most U.S. states. They were unable to build models with predictive validity of salvia usage, however; an as extreme example of the noisiness of the data, a Miley Cyrus incident where she was videotaped smoking salvia led to a dramatic spike in both social data sets. As part of RTI’s work, they coded 500 random comments from Twitter using two coders and an adjudicator when the coded disagreed; the two sentiment analysis systems they tested did little better than chance when coding these comments.
Alex Johnson of Kantar Operations shared another triangle (inspired by the classic cost, speed and quality triangle): the Kantar triangle shows consistency, representativeness and engagement. These often come at the expense of one another, and the triangle is “a way to communicate the often complex tradeoffs” to clients. For instance, using Flash in a survey increases engagement but shuts out some potential respondents; designing mobile surveys for smart phones reaches only a minority of users, yet designing mobile surveys using SMS sacrifices engagement in the name of representativeness. “The closer to the cutting edge a technology is, the smaller the breadth of reach for it.” Sacrificing consistency with the goal of maximizing engagement for each respondent requires producing multiple versions of the research, and “the data will be different, because engagement can be sensitive to demographics”. Of course, embracing the lowest common denominator is the worst of all worlds, creating surveys that don’t fit the platforms they are fielded on, often being too long for mobile and too tediously plain on PCs. “Now, questionnaire length has driven the engagement imperative in the past, and in fact short, simply surveys satisfy everyone. It’s in the context of larger questionnaires that we get a larger problem.” In fact, perhaps it is time to deemphasize consistency: “Change has become the norm, and we must adjust our expectations on consistency. There’s just too much change to exercise the kind of control we had in the past. The speed of change may have outstripped our ability to conduct research on research.”
James Turner of ICM concluded the conference by noting that the survey was 130 years old and – no matter what stories we tell ourselves to frighten ourselves – has at least 130 more years left in it as a methodology. Which will hopefully mean another 30 or 40 international conferences of the Association for Survey Computing.
Author Notes:
Jeffrey Henning
