For representative results, it is more important that sampling be well designed than that there be thousands of responses. Unfortunately, this is a distinction that most reporters ignore and that many researchers, in the interest of minimizing costs, obscure.
Probability sampling of telephone and cellphone numbers produces the highest quality, most representative results. Unfortunately, telephone surveys cost up to three times as much as nationally representative online surveys – cell phone numbers must be dialed manually (automatic dialing is legal for landlines but illegal for cell phones) and an hour worth of calls are required for every completed interview, according to Luth Research.
Unlike telephone surveys, online surveys vary widely in representativeness, from opt-in web polls that are only representative of those who voted, to sophisticated online surveys designed to be representative of the U.S. population in general. Different algorithmic techniques are used to improve the representativeness of online surveys, including web-site intercept surveying, sample matching, and statistical weighting.
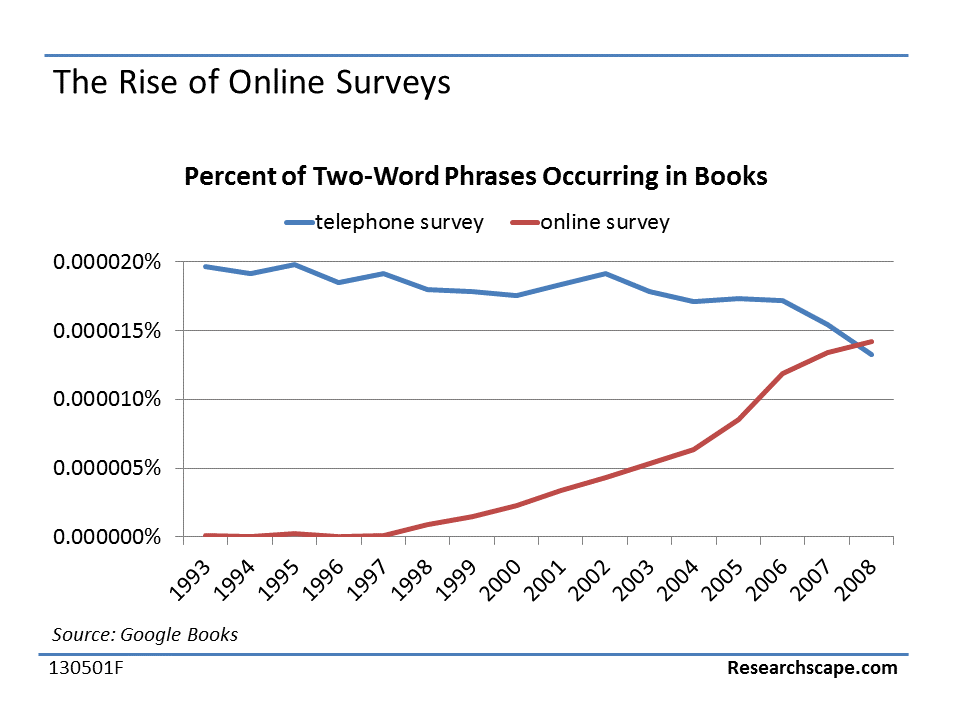
Larger news organizations have statistics departments that will evaluate surveys before reporting on them and will help reporters put online surveys in context. In fact, many media companies themselves now conduct online surveys and publish the results. Looking at books published from 1993 through 2008, references to “online surveys” have grown to surpass those of “telephone surveys”. (More recent data is not available.)
While online surveys have grown in popularity, some reporters are still skeptical of such research. The following types of online surveys are less likely to be written about:
- Those conducted using the sponsoring organization’s web site. “Forget it! It may be statistically representative of their customers, but it may not even be that,” said business and technology journalist Erik Sherman. “I don’t trust opt-in surveys.”
- Those done by the organization itself rather than with a third-party research firm. “I don’t automatically assume anything from Harris, for example, is okay, but I am more likely to give them the benefit of the doubt,” said Sherman. “I know if they start messing up that it will damage their professional reputation.”
- Those with raw, unmodeled results. While journalists willingly acknowledge that they are not experts when it comes to statistical modeling, they look for methodologies that improve the representativeness of the collected data.
Each of the above concerns about online surveys can and should be addressed. Reporters frequently write about those online surveys that demonstrate research best practices. “I want to know that the research was done professionally. It may be the only practical way,” said Sherman. “If the results are interesting, I will put in the caveats.”
Given the affordability, convenience and widespread acceptance of online surveys, 85% of surveys published in news releases are for online surveys.
A common practice to improve the representativity of online surveys is to divide the population into buckets (called cells) by age, gender, region, and other demographic variables, and then recruit respondents to fill each bucket. For instance, since 17% of the U.S. population is Hispanic, a survey might try to recruit 17% of its participants from the Hispanic community. And so on for each demographic.
A more sophisticated approach is to use sample matching or selection-bias modeling, which conceives of the population as ever more specific buckets. Instead of recruiting Hispanics overall, there will be different buckets for Hispanics by gender, age, region, and other variables. Leading practitioners of this approach include YouGov and Toluna.
Once the survey results are in, weighting can be applied to treat responses from some respondents as worth more than responses from other respondents in order to be even more representative of the overall population. For instance, for a survey interviewing 100 Americans ages 18 to 64 with 60 females and 40 males responding, the proper proportions for that age range should be 50/50. To correct for this, a survey researcher would weight each female’s answers to be worth 0.83 of a response and each male’s answers to be worth 1.25 responses. Now the survey results should, in theory, better reflect the target population. Of surveys published in 2016 news releases, only 10% were weighted, almost always by at least age, gender and geographic region.
 This is an excerpt from the free Researchscape white paper, “Amp Up News Releases with Newsmaker Surveys”;. Download your own copy now:
Author Notes:
Jeffrey Henning
