Since 2007, Forrester has published the CXi (originally abbreviated CxPi), a Customer Experience Index that measures the experience a company provides consumers across dimensions of usefulness, accessibility (ease of use) and emotional engagement.
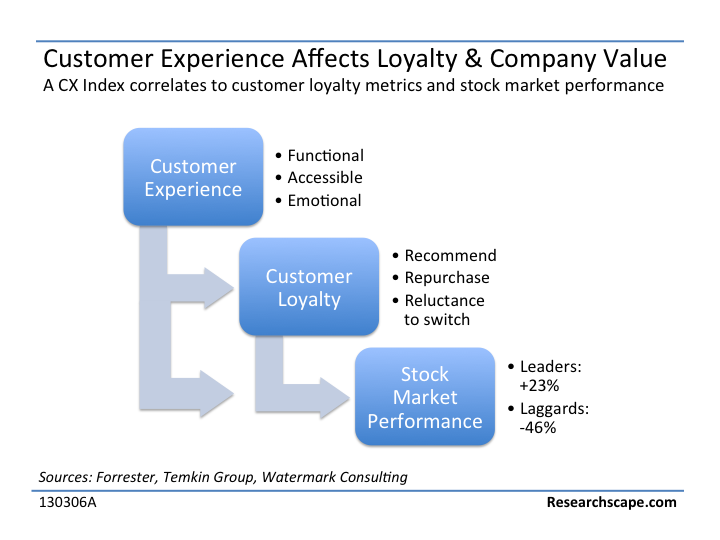
Forrester reports that its CXi correlates to the Net Promoter Score and to other customer loyalty metrics. Temkin Group – which has its own implementation of this index – also finds a correlation between customer experience and customer loyalty measures. Watermark Consulting reports that the Forrester CXi correlates to stock market performance, finding that the stock of CXi leaders appreciated 22.5% from 2007 to 2011, while the stock of CXi laggards fell 46.3%.
Given these results, we often include a customer-experience index in questionnaires that we write. However, both the Forrester and Temkin Group indices are worded for respondents who are evaluating many brands at once. Both, also, use scales that mix numbers and labels, which confuses some respondents, and both mix unipolar and bipolar scales across the three questions, again confusing some respondents.
As a result, in our surveys, we use a modified CXI, designed for our clients to evaluate the customer experience they provide. It’s three questions:
Functional Experience – Thinking about your recent interactions with us, how effective were we at meeting your needs?
- Met all of my needs
- Met most of my needs
- Met many of my needs
- Met some of my needs
- Didn’t meet any of my needs
Accessible Experience – Thinking about your recent interactions with us, how easy were we to work with?
- Extremely easy
- Very easy
- Moderately easy
- Slightly easy
- Not at all easy
Emotional Experience – Thinking about your recent interactions with us, how enjoyable were the interactions?
- Extremely enjoyable
- Very enjoyable
- Moderately enjoyable
- Slightly enjoyable
- Not at all enjoyable
Both Forrester and Temkin Group calculates net scores for these questions, which actually lowers predictive validity when used on word of mouth recommendations and, presumably, on this index as well. Converting the answers to a 1 to 5 scale for analysis and then averaging the three questions is simpler and will yield a higher correlation to customer satisfaction and customer loyalty in your own research. But this is a minor complaint.
I appreciate the work Forrester and the Temkin Group do championing this index, and encourage you to check out their reports: The Customer Experience Index, 2013 and 2016 Temkin Experience Ratings.
Author Notes:
Jeffrey Henning
