The GreenBook team included a new section on panel satisfaction in their GreenBook Research Industry Trends Report survey of 2,087 researchers around the world.
While some survey researchers can make do with house lists and their own panel, 79% use panel providers.

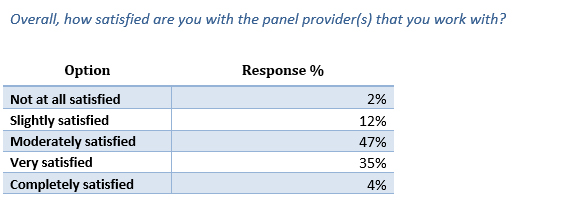
Only 40% of survey researchers who use panel providers are very or completely satisfied with the providers that they work with.

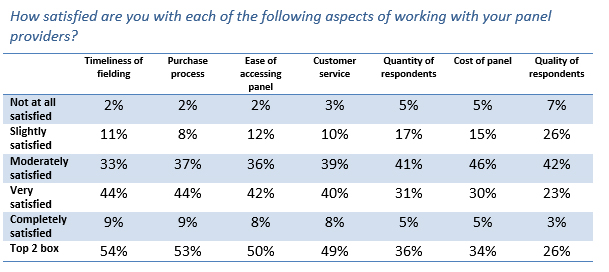
A majority of panel customers were very or completely satisfied with timeliness of fielding (54%), the purchase process (53%), and the ease of accessing panel (50%). Satisfaction was lowest with the quality of respondents (26%), the cost of panel (34%), the quantity of respondents available (36%), and customer service (49%).

Which attributes of satisfaction have the highest correlation to overall satisfaction? The quality of respondents is the primary driver, with a 0.545 correlation, explaining 30% of the shared variance between the two measures. Next in importance is customer service, with a 0.468 correlation (22% of shared variance). Rounding out the top three is the quantity of respondents available: 0.441 correlation, 19% shared variance.

While the cost of panel will always inform purchase decisions, it has less of a role in overall satisfaction. Cost had the second-lowest derived importance, with a correlation to overall satisfaction of 0.372 (14% variance), just above the ease of accessing panel (0.357, 13%).
Discriminant analysis, also known as derived importance, has greater predictive validity than stated importance for understanding drivers of overall ratings. However, items with low variability – such as purchase process, which had the lowest standard deviation of the seven attributes – may have their real-world importance underestimated by this analysis.
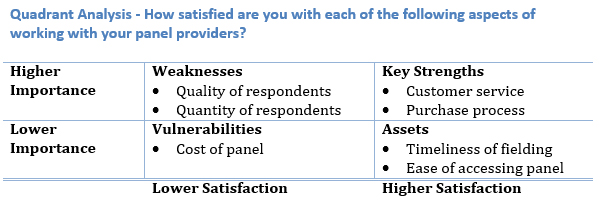
A quadrant analysis of satisfaction vs. importance, splitting each axis by its median value, provides a useful way to group attributes (median values are included in the higher quadrant for that dimension). Key strengths, which are high in derived importance and high in top-two box satisfaction, are customer service and the purchase process. Weaknesses – which drive overall satisfaction but score in the lower half of attributes for satisfaction – center around the quality and quantity of respondents available.

Of those items that are less important, assets are timeliness of fielding and the ease of accessing panel. The one vulnerability (lower in importance, lower in satisfaction) is cost of panel.
Panel companies’ investment in providing 24-hours-a-day, 7-days-a-week customer service through a mix of on-shore and offshore customer service representatives has produced high satisfaction. So has the development of online interfaces that automate the purchase of panel for many common respondent demographics.
However, much of the concern with panels across social media and the blogosphere centers on respondent quality, and that issue resonates with the wider audience of market researchers surveyed for GRIT.
You can download the GRIT report from here. Doing so will also make sure you are notified as soon as the new report is released.