For the 20th edition of the GreenBook Research Industry Trends Report, we followed up our research into panel satisfaction by looking at provider satisfaction. The GRIT study was an online survey fielded in Q3 and Q4 of 2016 and collecting 1,583 responses from participants in 76 countries.
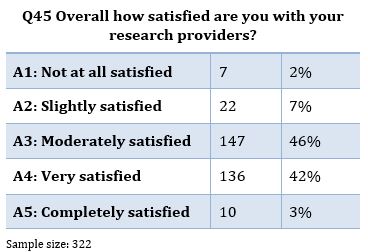
Only 45% of corporate researchers are very or completely satisfied with their research providers. Though this compares favorably to panel providers: prior research found that only 40% of corporate researchers and supplier researchers were very or completely satisfied with their panel providers.
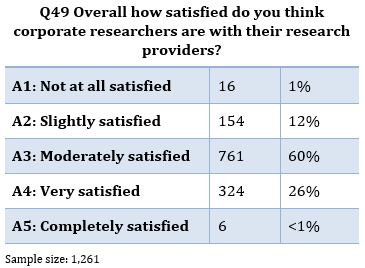
Research providers themselves were more pessimistic about how they were regarded: only 26% believed that corporate researchers were very or completely satisfied.
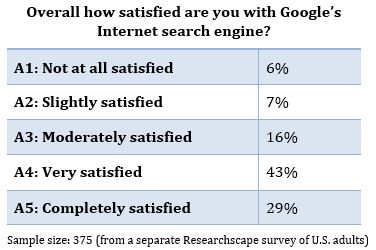
Researchers being researchers, some criticized this scale as being too harsh: why not make the top label “very satisfied”? Primarily because of research that “totally satisfied customers were six times more likely to re-purchase Xerox products over the next 18 months than its satisfied customers” (“Beyond customer loyalty”; Heskett, James L.; Managing Service Quality: An International Journal 2002 12:6 , 355-357.) Striving for complete client satisfaction should be a goal for the research industry. In fact, one information provider has 29% of its users “completely satisfied”: Google. And it bests research and panel providers on top-two-box satisfaction: 45% for research providers, 40% for panel providers, and 72% for Google search.
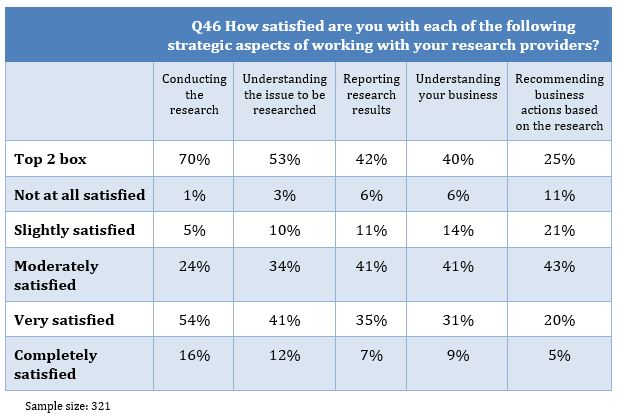
A majority of corporate researchers were very or completely satisfied with how research providers conduct the research (70%) and understand the issue to be researched (53%). Four out of ten were satisfied with the reporting of research results and understanding of the business. Satisfaction was lowest with recommendations for business actions based on the research, at 25%.
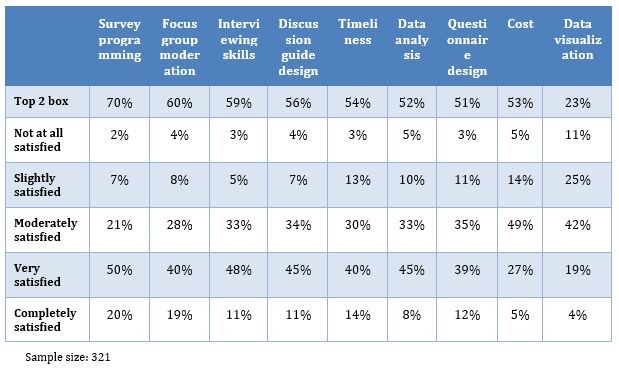
Besides these strategic issues, corporate researchers also evaluated providers on a range of tactical aspects related to delivering research. The majority of corporate researchers are satisfied with all but two aspects: data visualization (only 23% are very or completely satisfied) and cost (32%).
Satisfaction is highest with survey programming (70% very or completely satisfied) and focus group moderation (60%). Interviewing skills, discussion-guide design, timeliness, data analysis, and questionnaire design only have top-two-box satisfaction levels between 51% and 59%.
Which attributes of satisfaction have the highest correlation to overall satisfaction? The process of conducting the research is the primary driver, with a 0.548 correlation, explaining 30% of the shared variance between the two measures. Next in importance is understanding the issue to be researched, with a 0.508 correlation, and recommending business actions based on the research, with a 0.506 correlation (each with 26% of the shared variance). The top-five aspects were all the strategic aspects, with understanding of the business and reporting research results rounding out the top five.
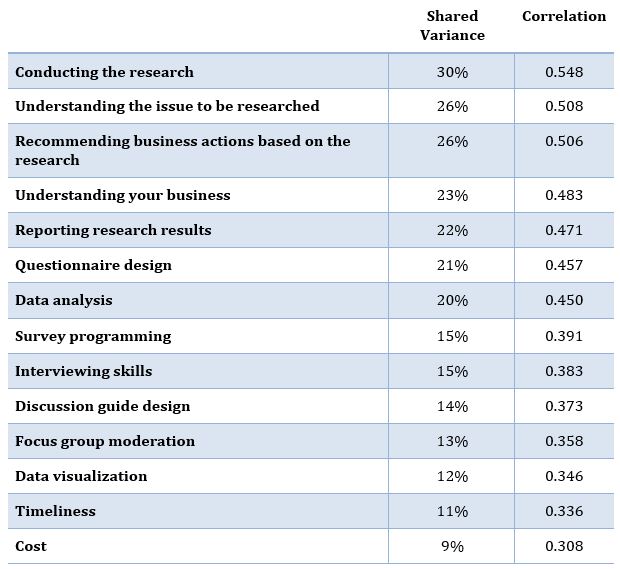
Of the tactical issues, the most important was questionnaire design, explaining 21% of the shared variance, and data analysis, explaining 20% of the variance.
While the cost of the research will always inform purchase decisions, it had the least role in overall satisfaction of the 14 aspects measured: cost had the lowest derived importance, with a correlation to overall satisfaction of 0.308 (9% variance), just below timeliness (11% variance).
A quadrant analysis of satisfaction vs. importance, splitting each axis by its median value, provides a useful way to group attributes (median values are included in the lower quadrant for that dimension). Key strengths, which are high in derived importance and high in top-two box satisfaction, are understanding the issue to be researched and conducting the research. Weaknesses – which drive overall satisfaction but score in the lower half of attributes for satisfaction – include the other three strategic aspects (recommendations, understanding the business, and reporting results) and the two most important tactical aspects (questionnaire design and data analysis).
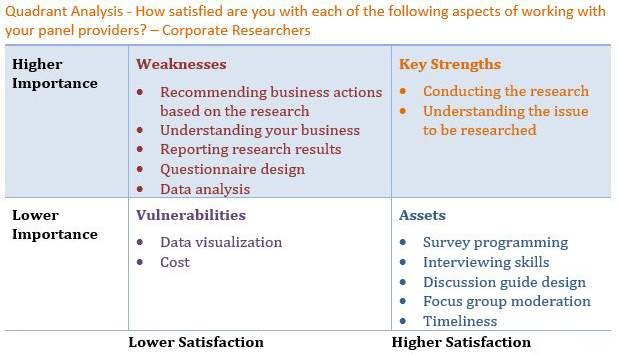
Of those items that are less important, assets are survey programming, interviewing skills, discussion guide design, focus group moderation, and timeliness—all with higher satisfaction. The two vulnerabilities (lower in importance, lower in satisfaction) are data visualization and cost.
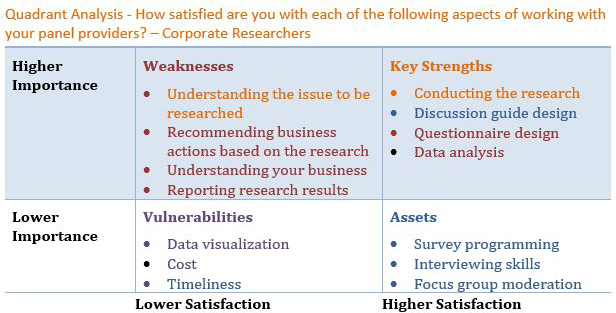
To what extent are research providers themselves in tune with what drives the satisfaction of corporate researchers? Providers correctly recognize that conducting the research is a key strength, but are too hard on themselves when it comes to understanding the issue to be researched, seeing it as a weakness when their clients see it as a key strength.
Conversely, research providers consider questionnaire design and data analysis to be key strengths, though corporate researchers regard these as weaknesses.
The only other disconnect is that researchers expect satisfaction with timeliness to be a vulnerability when it is in fact an asset.
The strategic imperative for research providers is to develop better understandings of their clients’ businesses, in order to better tailor research reporting and to better recommend business actions.
Author Notes:
Jeffrey Henning
